
What is google analytics? Google Analytics is a free web analytics tool offered by Google, which allows you to track and analyses your website users.
It allows you to easily measure visitor interaction with your website content and digital services. Google Analytics is a brilliant tool as it allows simple and complex implementation. Bringing huge value to businesses both large and small. Whether seeing how many visitors are viewing your company services page or purchasing a hat on your online store. Google analytics allows for tracking and interpretation of both these types of website interactions.
Why use google analytics?
Simply put, it is a free resource, easy to setup, with years of learnings and growth included. Perhaps the better question is why would you not use it. For more on how to setup Google Analytics view the official Get started documentation.
Google analytics tracks data in four key ways:
- Users – each individual
- Sessions – number of visits to your website by the individual
- Pageviews – number of pageviews by a user
- Events – number of interactions by a user
What is the difference between metrics and dimensions?
It is also important to understand the difference between metrics and dimensions within Google Analytics. A metric is the data collected by Google and a dimension is a way in which you can view that data.
For example, you can view the total number of pageviews of your site, but without seeing a daily breakdown in pageviews and individual pages, this information cannot bring any meaningful insights to your business. For more on the official Google Analytics dimensions and metrics definitions view the official documentation.
Key Reporting Features
Google Analytics has a number of excellent features included, in this article we will just cover the high-level reports. Aimed to give ideas for reports that could be used in a first-time implementation for your business.
Key google analytics reports:
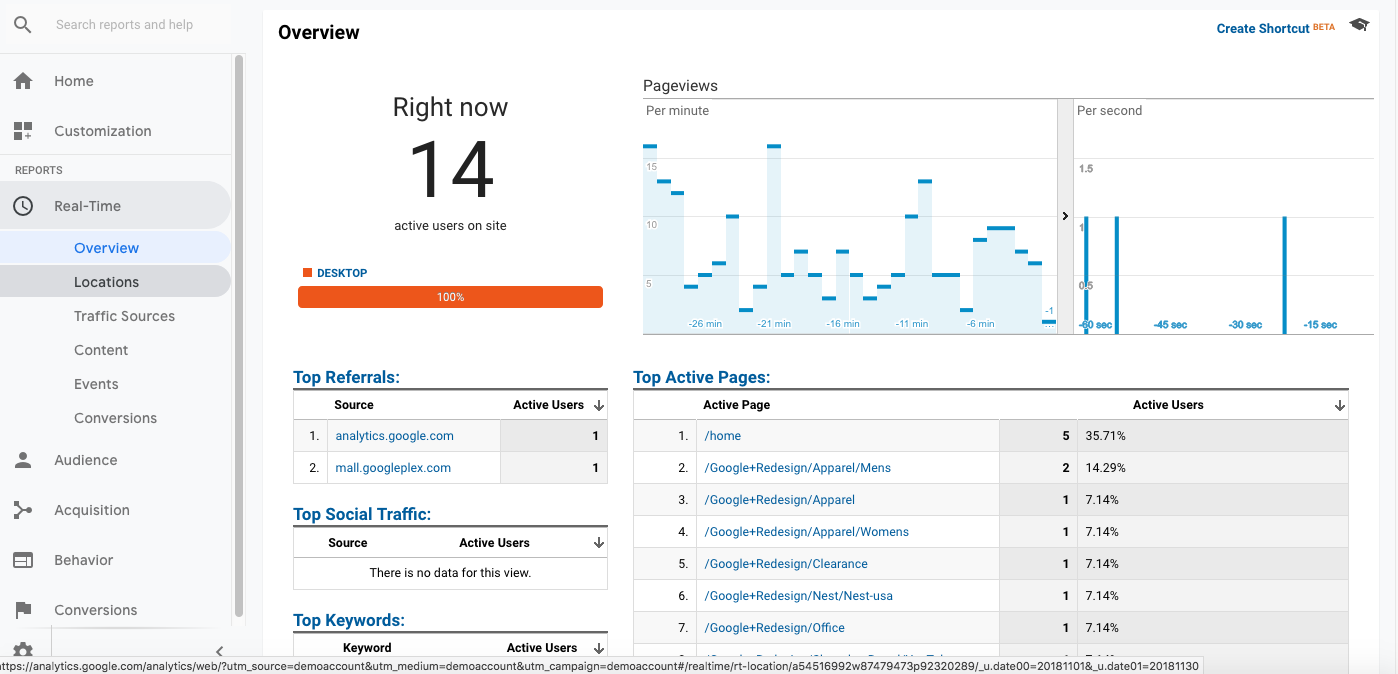
- Real-time report: Allows you to monitor activity as it is occurring, LIVE reporting. The report is updated continuously and each hit is reported seconds after it happens. For example you can see how many people are on your site right now, and what pages they are viewing.

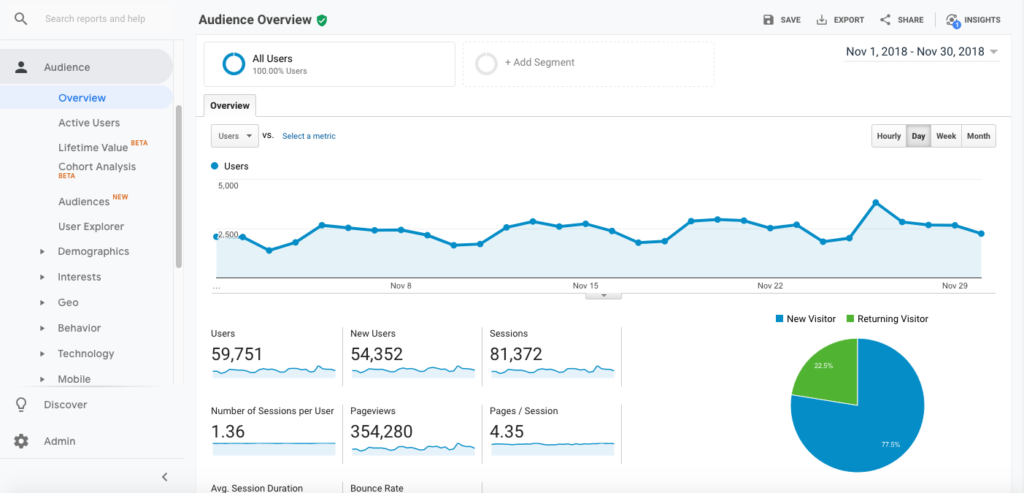
- Audience reports: Provides insight into characteristics of your users, some keys reports, shows the percentage of new vs returning visitors. Location of users as well as visiting devices, ie desktop vs mobile vs tablet.
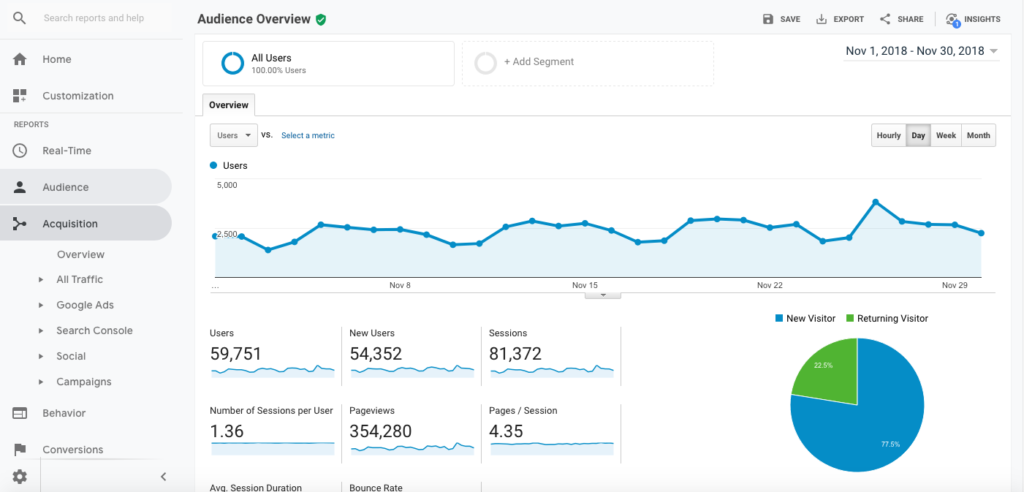
- Acquisition reports: Gives insight into your users “Acquisition-Behavior-Conversion (ABC) cycle: how you acquire users, their behaviors on your site after they enter, and their conversion patterns. The acquisition reports also include advertising reports and gives you an idea of your paid traffic.
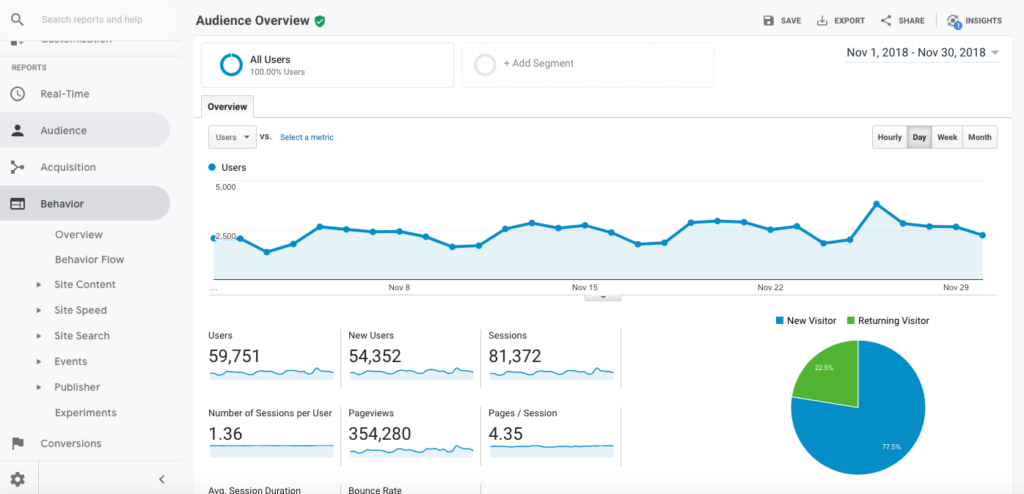
- Behavior reports: Provide insight into how users interact with you site. Such as what pages people view, the speed of your website, what searches users perform and also allows you to run experiments with content a very powerful tool. Something we will cover in another article.
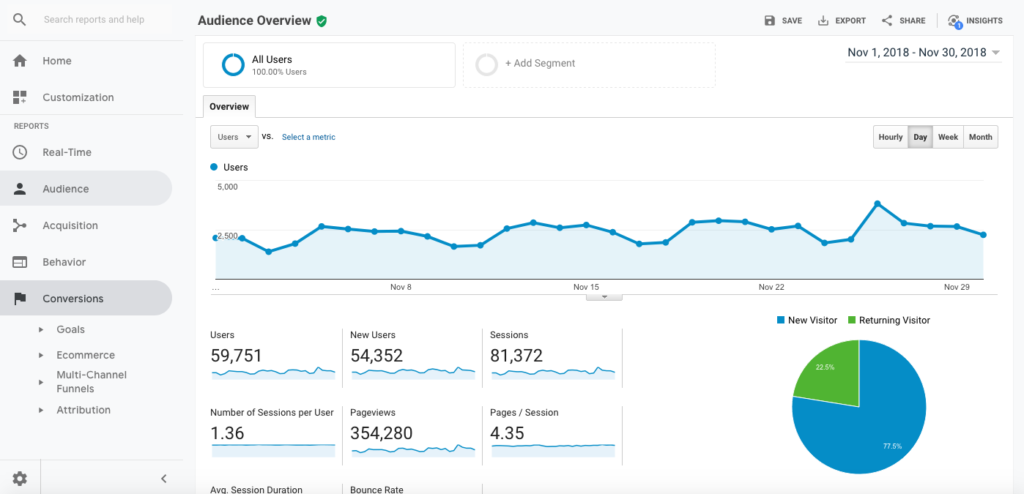
- Conversions reports: These reports show the different conversions across your website. For these reports to function, goals and ecommerce tracking need to be setup. These reports allow you to tangibly measure the success of your website. A conversion is the completion of an activity that you set on your website. Such as a newsletter signup, a form submission or a key page view.


So being new to Google Analytics, an easy starting point would be to view a breakdown of the most popular pages on your site for the first month or week. This will give you a nice top level view of what content is most popular on your site.
Some other easy to view reports would be:
- Top landing pages, these are the pages which people enter the site through
- Exit pages, these are the pages people are leaving your site from
These reports can give you an idea of users are interacting with the content on your website very quickly.
Google Analytics is a very powerful tool, and these are just some small examples of how it can help you measure and review how your website is performing.